Application: Kelmarsh wind farm
Ten-minute SCADA data of the six Senvion MM92 turbines of Kelmarsh wind farm (UK): Plumley, C. & Takeuchi, R.,
Kelmarsh wind farm data, Zenodo, doi:10.5281/zenodo.16807551,
CC-BY-4.0, downloaded at run time. The data set was chosen by a screening with an approval criterion fixed before
the analysis; the study was then repeated on all six turbines under a protocol also fixed before the run. The full
material is in
comparison/applications/
(README, screening.py, kelmarsh_case_study.ipynb, kelmarsh_all_turbines.py). Numbers are reported without
interpretation.
Screening criterion
A candidate passes if, with p = 2 components, the mean out-of-sample VAF of qlPCA with 1 or with
2 interior knots is at least 5 percentage points higher than the mean out-of-sample VAF of linear PCA
(n_knots=0) on the same data and folds. The results for p = 3 and the in-sample VAF are reported but do not
enter the decision. The numbers are reported without interpretation.
If Kelmarsh does not pass, the same procedure is repeated with Hill of Towie.
All turbines: protocol
Fixed on 2026-11-15, before any computation on turbines 2 to 6. Implemented in kelmarsh_all_turbines.py
(notebook kelmarsh_all_turbines.ipynb); results in results/ with the prefix all_.
- Turbines and years. Kelmarsh 1 to 6; analysis year 2019; boundary year 2018. The pipeline of the Kelmarsh 1
case study is applied without changes: the same 8 variables (wind speed, power, rotor speed, pitch angle,
nacelle, generator, gearbox and ambient temperatures); the same filter (remove records overlapping Stop or
Communication events,
Power <= 0and missing values; keep records overlapping Warning events, flaggedwarning_active); a sample of 2000 records withnumpy.random.default_rng(2026); 5 contiguous time blocks; the same out-of-sample VAF criterion (test rows clipped to the training range); gains paired by block. - Boundaries. B1 to B4 are estimated on 2018 for each turbine with the same method (medians by wind classes of 0.5 m/s with at least 30 records; thresholds at 5 % of the range of each median; B3 searched above the wind of the minimum pitch median). They are reported in a table per turbine.
- Exclusion rule. A turbine is excluded only if, in 2019 or in 2018, it has fewer than 20 000 records after filtering, or if any of the boundaries cannot be estimated. Exclusions and their reason are reported.
- Models per turbine (p = 2): PCA; percentiles with 2 knots per variable; percentiles with the same number of
interior knots per variable as the control-region model; control regions (2018); the last two also with
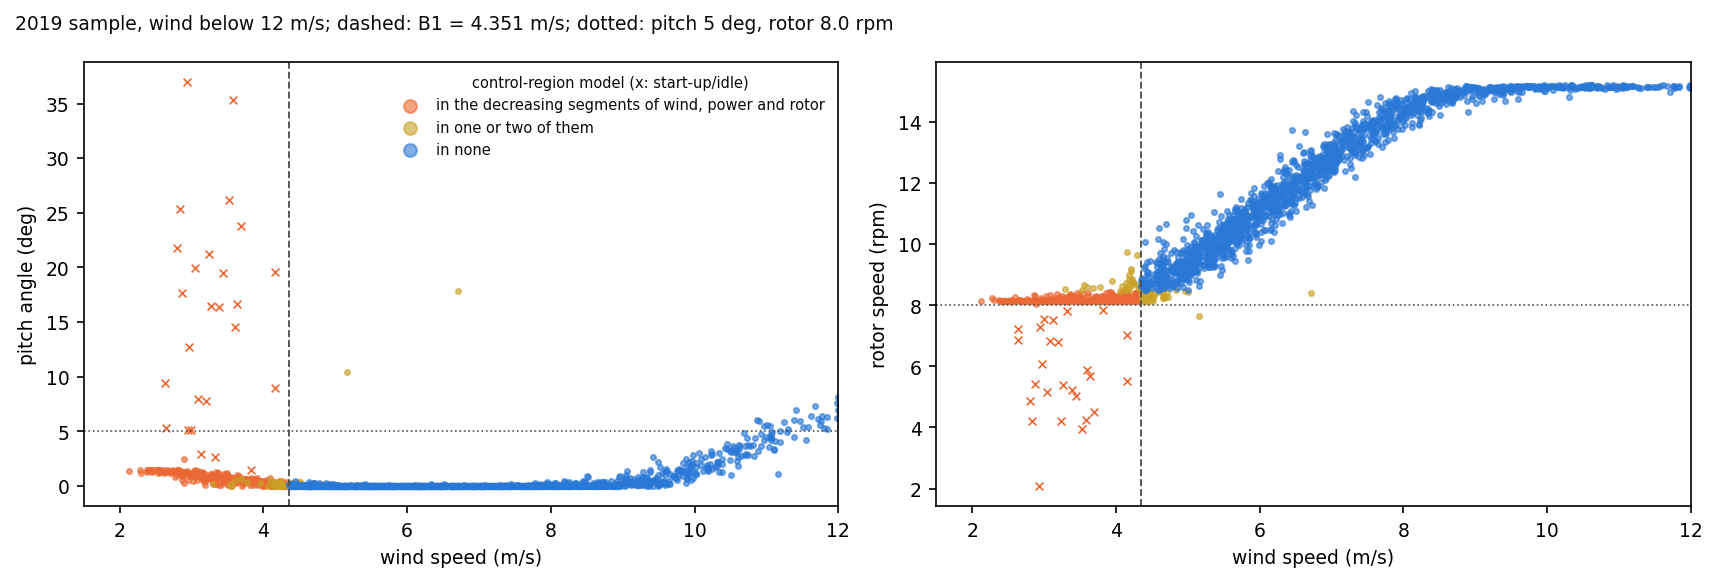
monotone=True. - Main results. (a) per turbine, the paired difference "control regions minus percentiles with the same number of knots" and its standard error over the 5 blocks, in the unrestricted and the monotone versions; (b) the number of turbines in which that difference is positive; (c) the mean of the differences over the turbines and its standard error between turbines (sd / sqrt(number of turbines)). Also reported: the gain of each model over PCA; the correlation between rotor speed and generator speed per turbine (to confirm that dropping generator speed applies to all); the number of start-up / idle records below B1 (pitch > 5° or rotor speed < 8.0 rpm) and the gain of the control-region model without them; whether the segments below B1 of wind speed, power and rotor speed are decreasing in each turbine.
- Sensitivity. The results of (a) without the
warning_activerecords. - Check. Kelmarsh 1 must reproduce the case study (paired gain of the control-region model over PCA 10.97; difference control regions minus percentiles with the same number of knots 1.98). If it does not, the run stops.
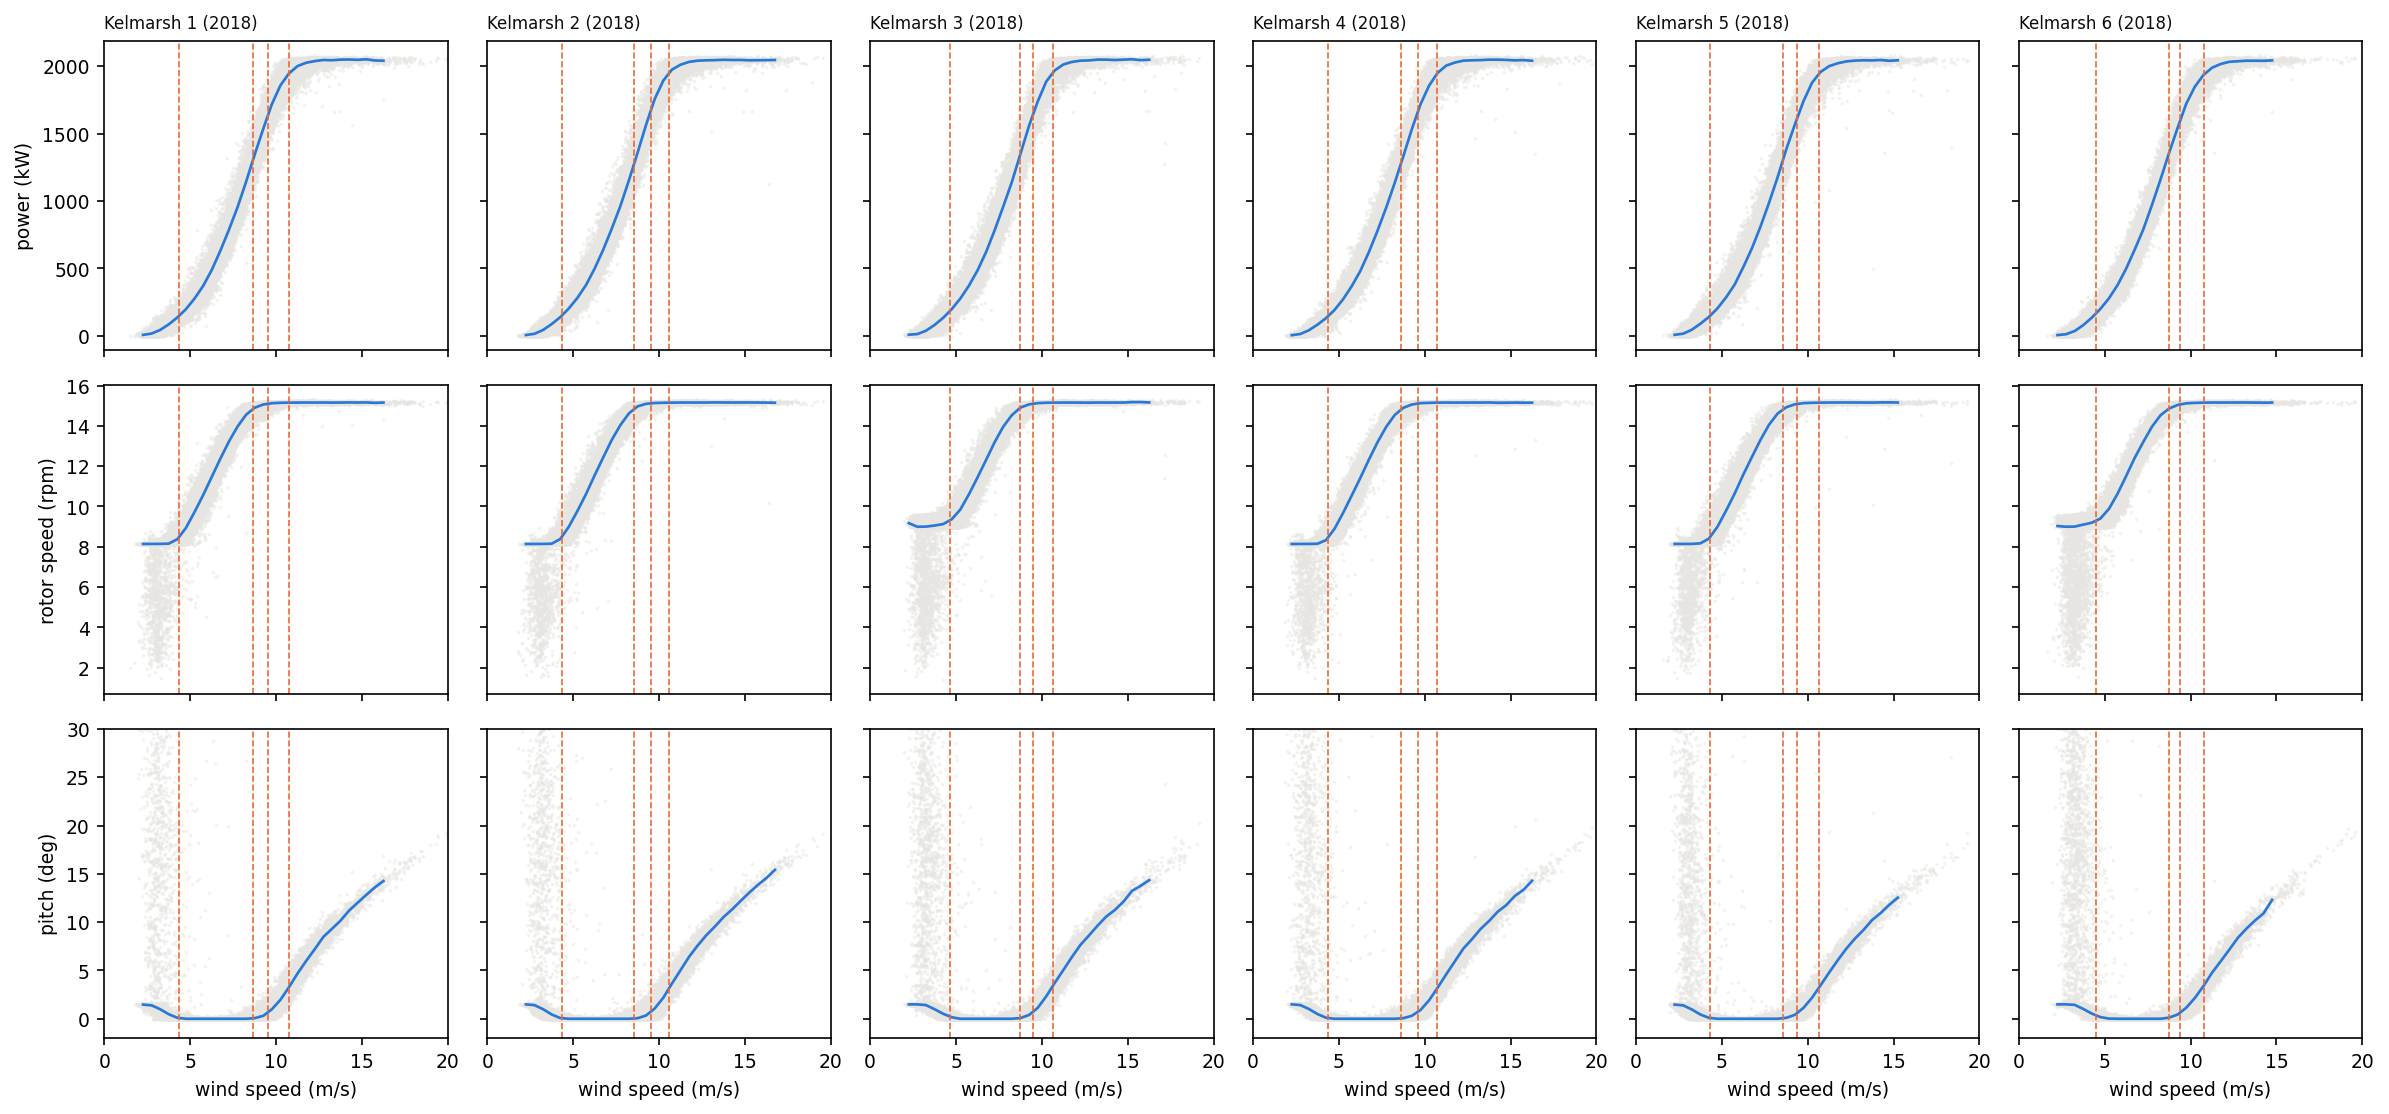
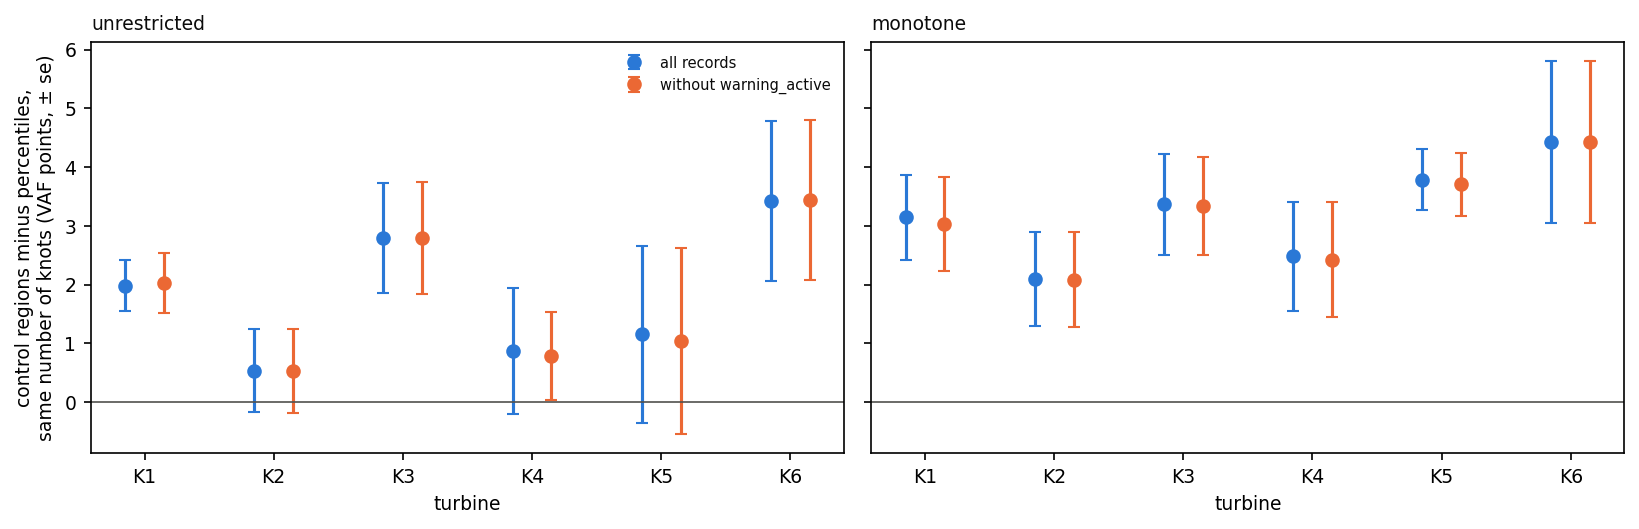
Figures: the difference (a) per turbine with error bars, unrestricted and monotone; the 2018 operating curves of the six turbines with B1 to B4. Numbers are reported without interpretation.
All turbines: results
Run with kelmarsh_all_turbines.py under the protocol above. Check: Kelmarsh 1 reproduces the case study
(paired gain of the control-region model over PCA 10.97; difference 1.98). No turbine excluded: records after
filtering 45 567 – 47 921 in 2019 and 44 044 – 45 990 in 2018; all boundaries estimated.
Boundaries (2018), wind speed in m/s, and the rotor-speed and pitch thresholds:
| turbine | B1 | B2 | B3 | B4 | B1 threshold (rpm) | B3 threshold (deg) |
|---|---|---|---|---|---|---|
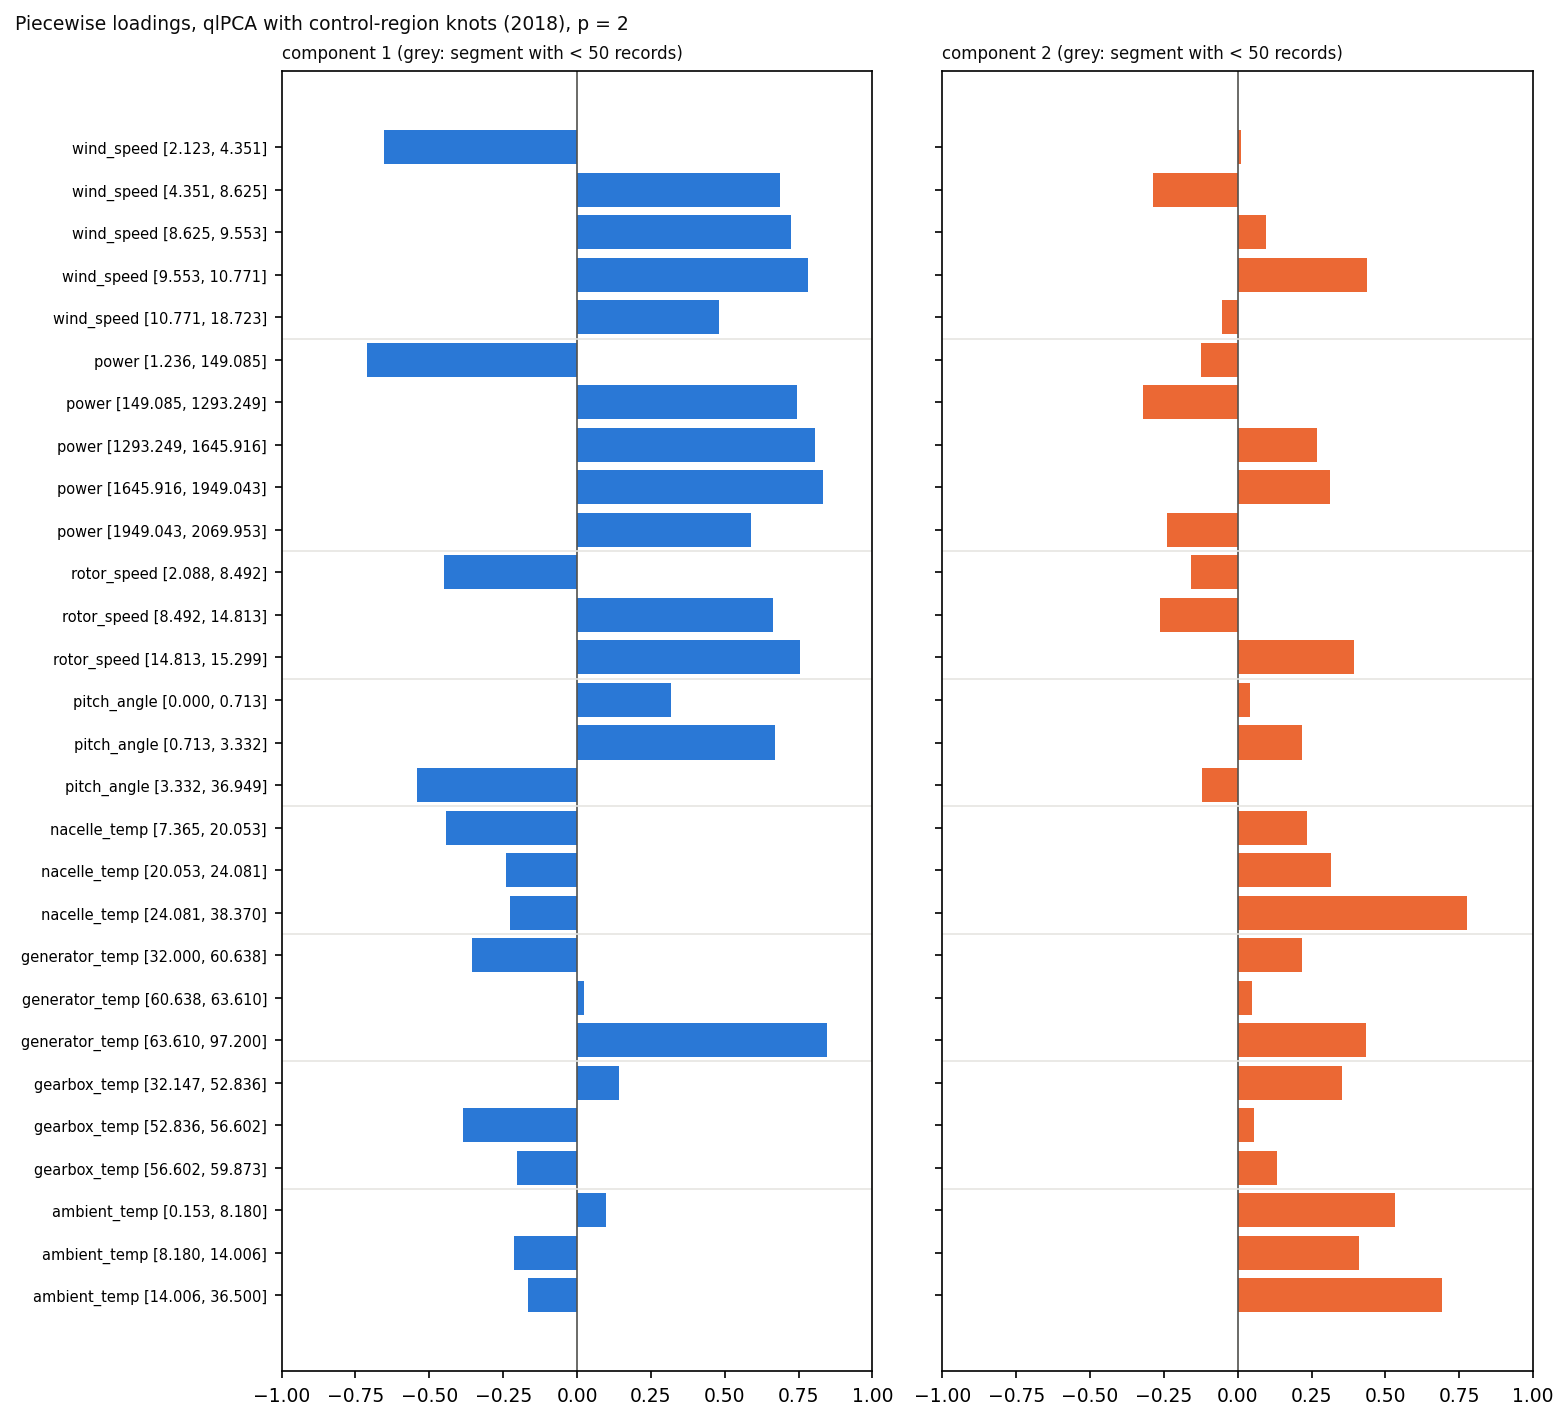
| Kelmarsh 1 | 4.351 | 8.625 | 9.553 | 10.771 | 8.492 | 0.713 |
| Kelmarsh 2 | 4.335 | 8.528 | 9.545 | 10.572 | 8.490 | 0.771 |
| Kelmarsh 3 | 4.620 | 8.704 | 9.474 | 10.632 | 9.303 | 0.718 |
| Kelmarsh 4 | 4.389 | 8.630 | 9.590 | 10.726 | 8.491 | 0.714 |
| Kelmarsh 5 | 4.322 | 8.575 | 9.407 | 10.668 | 8.492 | 0.627 |
| Kelmarsh 6 | 4.513 | 8.739 | 9.374 | 10.811 | 9.303 | 0.615 |
In Kelmarsh 3 and 6 the lowest rotor-speed median of 2018 is about 9 rpm, against about 8.1 rpm in the other four
(figure all_operating_curves_2018). The control-region model has 4, 4, 2, 2 interior knots for wind, power, rotor
and pitch and 2 per temperature in every turbine (28 parameters; the same-number percentile model 27).
Paired gain over PCA, out of sample (VAF points; se over the 5 blocks in brackets):
| model | K1 | K2 | K3 | K4 | K5 | K6 |
|---|---|---|---|---|---|---|
| percentile knots | 8.53 (1.97) | 11.93 (1.92) | 8.04 (2.35) | 11.45 (2.30) | 10.60 (2.42) | 7.88 (2.45) |
| percentiles, same number of knots | 8.98 (2.06) | 12.77 (1.90) | 8.68 (2.33) | 12.22 (2.31) | 11.21 (2.45) | 8.36 (2.42) |
| percentiles, same number of knots, monotone | 6.87 (1.10) | 9.97 (0.73) | 6.87 (1.66) | 8.93 (0.81) | 7.25 (1.14) | 5.85 (1.83) |
| control regions (2018) | 10.97 (2.15) | 13.30 (1.84) | 11.48 (2.76) | 13.09 (2.09) | 12.36 (1.53) | 11.78 (3.22) |
| control regions (2018), monotone | 10.02 (1.80) | 12.06 (1.44) | 10.23 (2.49) | 11.40 (1.61) | 11.04 (1.40) | 10.27 (3.02) |
Out-of-sample VAF of PCA: 71.95, 69.42, 69.55, 69.14, 68.85, 69.93.
Main results: control regions minus percentiles with the same number of knots (paired over the 5 blocks):
| turbine | unrestricted | monotone | unrestricted, without warning_active |
monotone, without warning_active |
|---|---|---|---|---|
| Kelmarsh 1 | 1.98 (0.43) | 3.15 (0.72) | 2.03 (0.51) | 3.03 (0.81) |
| Kelmarsh 2 | 0.54 (0.70) | 2.09 (0.80) | 0.53 (0.71) | 2.08 (0.81) |
| Kelmarsh 3 | 2.80 (0.94) | 3.36 (0.85) | 2.79 (0.95) | 3.34 (0.83) |
| Kelmarsh 4 | 0.87 (1.07) | 2.48 (0.93) | 0.78 (0.75) | 2.43 (0.98) |
| Kelmarsh 5 | 1.15 (1.51) | 3.79 (0.52) | 1.04 (1.59) | 3.70 (0.53) |
| Kelmarsh 6 | 3.42 (1.37) | 4.42 (1.38) | 3.43 (1.36) | 4.43 (1.38) |
| (b) positive | 6 of 6 | 6 of 6 | 6 of 6 | 6 of 6 |
| (c) mean (se between turbines) | 1.79 (0.47) | 3.21 (0.35) | 1.77 (0.48) | 3.17 (0.35) |
Records flagged warning_active in the 2000-record samples: 365, 1, 1, 81, 3, 1.
Other facts per turbine:
| turbine | corr(rotor, generator) | records below B1 | start-up/idle below B1 | control-region gain without them (se) | lowest segments of wind / power / rotor |
|---|---|---|---|---|---|
| Kelmarsh 1 | 1.0000 | 348 | 26 | 7.88 (0.75) | decreasing / decreasing / decreasing |
| Kelmarsh 2 | 1.0000 | 376 | 35 | 9.98 (1.67) | decreasing / decreasing / decreasing |
| Kelmarsh 3 | 1.0000 | 480 | 34 | 8.36 (2.65) | decreasing / decreasing / decreasing |
| Kelmarsh 4 | 0.9999 | 361 | 42 | 9.30 (1.62) | decreasing / decreasing / decreasing |
| Kelmarsh 5 | 1.0000 | 451 | 35 | 8.81 (1.26) | decreasing / decreasing / decreasing |
| Kelmarsh 6 | 1.0000 | 548 | 49 | 8.06 (2.11) | decreasing / decreasing / decreasing |
Correlations to four decimals. The start-up/idle definition (pitch > 5° or rotor < 8.0 rpm) is the one fixed in the protocol; it was not adapted to the 9 rpm rotor-speed floor of Kelmarsh 3 and 6.
Files: all_inclusion.csv, all_boundaries.csv, all_vaf.csv, all_differences.csv, all_turbine_facts.csv,
all_summary.json; figures all_differences, all_operating_curves_2018 (PDF and PNG).
Figures
Control regions in 2018 (medians in 0.5 m/s wind classes and the boundaries B1–B4), six turbines:
Control regions minus percentiles with the same number of knots, per turbine (± standard error over the 5 blocks):
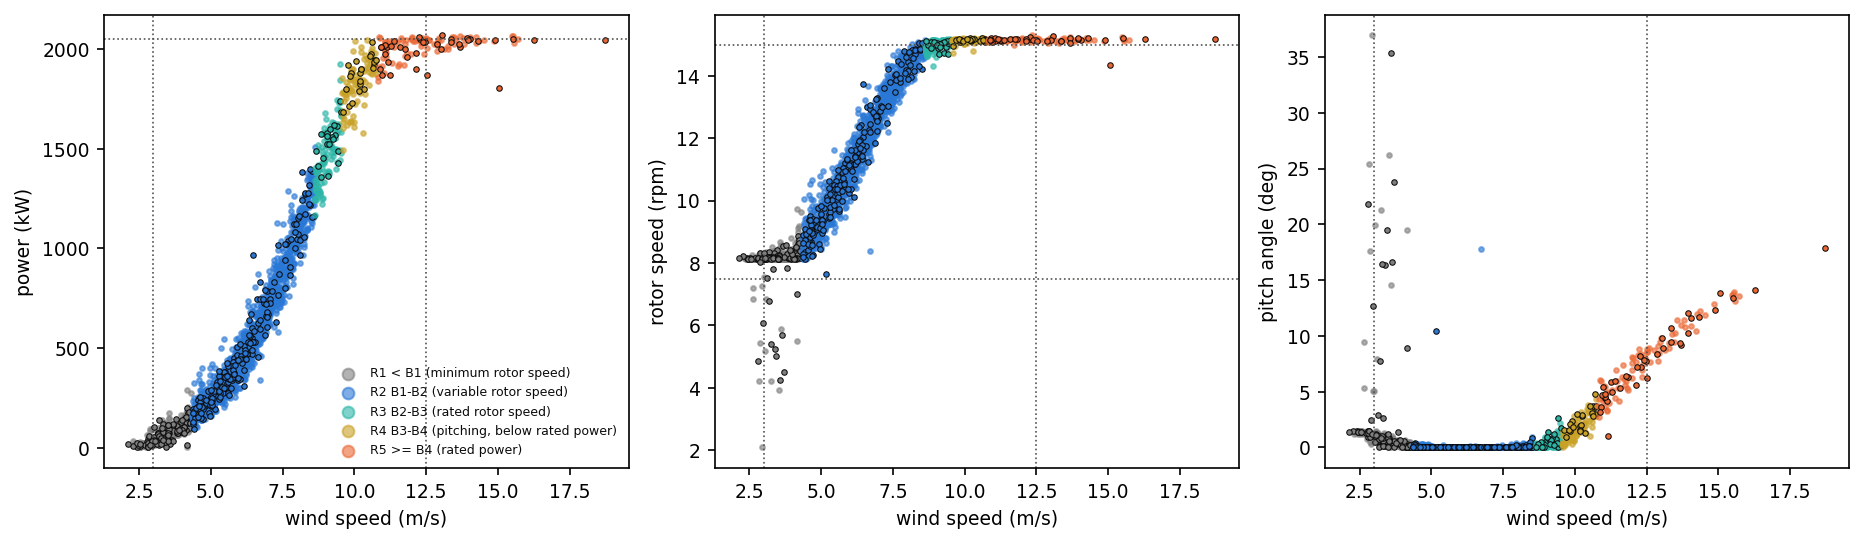
Kelmarsh 1, 2019 sample by control region:
Kelmarsh 1, piecewise loadings of the control-region model:
Kelmarsh 1, records below B1 by membership of the decreasing segments (start-up / idle records marked ×):